5 Company Profitability Metrics Every Investor Should Understand
When investing in individual company stocks, it's crucial to delve deep into the company's profitability. Let’s explore five key metrics representing a company's profitability to comprehensively analyze its earnings potential.

1.Net Profit
To gauge a company's profitability, the first metric we need to examine is net profit. Net profit refers to the total profit of an enterprise for the period after deducting income tax, i.e., the company's after-tax profit.
Net profit is the most straightforward indicator of a company's profit situation. A positive net profit indicates that the company is making money, while a negative net profit indicates losses. For investors, it's natural to want companies to earn as much as possible, as it signifies a promising return on our investment.
However, solely focusing on net profit isn't conducive to horizontal comparisons between companies. For instance, consider a company with assets worth $1 billion earning a net profit of $10 million annually, and another with assets worth $100 million earning $5 million annually. Which company would you choose to invest in?
Based solely on net profit, you might opt for the $1 billion asset company since it earns more. But it may not be the best choice. Taking into account the scale of assets, the company with $100 million assets is the optimal choice.
Therefore, looking at net profit alone helps eliminate consistently loss-making companies. To select truly promising companies, we need to consider other relative profitability metrics, such as Return on Total Assets, Operating Profit Margin, and Return on Equity.

2.Return on Total Assets
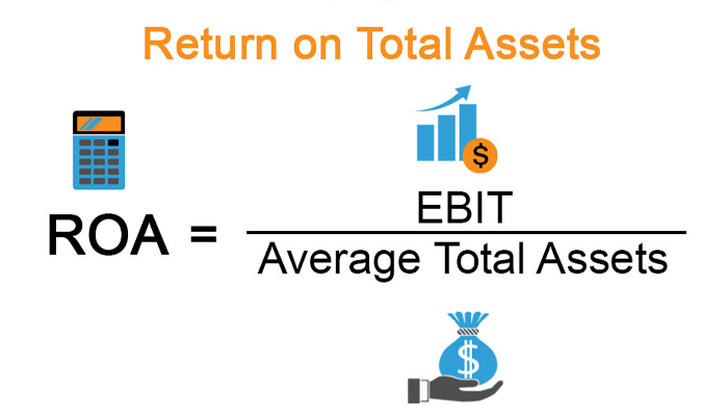
Return on total assets (ROA) is the ratio of net profit to total assets, reflecting the net profit generated per dollar of total assets. A high return on total assets indicates efficient utilization of assets by the company.
Through return on total assets, we can compare the efficiency of asset utilization among different companies. Since the structure of each company varies, as investors, we are more concerned about how efficiently each dollar of our investment as shareholders can generate profit.
At this point, we can further examine the return on equity (ROE).

3.Return on Equity
Return on equity (ROE), also known as net asset return rate, is the ratio of net profit to shareholders' equity, reflecting the net profit earned per dollar of shareholders' equity.
Warren Buffett once said, "If I were forced to use only one measure to evaluate how well a company is doing, I would choose ROE."
ROE can tell us how much net profit we can earn for every dollar we invest, closely related to our interests as shareholders. We can focus on this metric. Generally, when looking at ROE, we want to find companies that consistently create wealth for shareholders in the long term. We can examine the ROE data for the past three or even five years.
If a company can maintain an ROE of 10%-15%, we consider it average. If a company can maintain an ROE of 15%-20%, we consider it excellent. If a company can maintain an ROE of 20%-30%, we consider it outstanding.
If you can find such an outstanding company, you can conduct an in-depth analysis as a potential investment target.

4.Operating Profit Margin
Operating profit margin is the ratio of net profit to operating income, reflecting the company's operational performance. Operating income reflects the company's overall sales situation.
Through operating profit margin, we can understand the company's business situation. A high operating profit margin indicates good business operations, while a low operating profit margin indicates poor business operations.
However, it's important to note that operating income includes both main business income and other business income. If you want to further understand the company's business situation, you also need to examine the proportion of main business income. A higher proportion of the main business income indicates the company's significant competitive advantage in its core business, which may lead to sustainable operations.

5.Net Profit Growth
The indicators mentioned earlier reflect the profitability of the company. However, to assess the sustainability of the company's profits, we can look at the net profit growth.
The net profit growth is a year-on-year growth indicator of net profit, representing the percentage increase in net profit from the current period compared to the previous period. We all prefer companies with consistently growing net profit, as it indicates the company's profitability can be sustained.
However, net profit growth can occur in two scenarios: when a company transitions from loss to profit, or when a profitable company continues to grow its profits. Which type of company should we choose? Naturally, we prefer companies that maintain profitability and continue to grow. After all, as investors, we seek consistent profits rather than fluctuating returns.
Conclusion
If you find it cumbersome to examine all five indicators, we recommend prioritizing net profit, ROE, and net profit growth. These three indicators are often available in commonly used stock trading software. If you haven't looked at them yet, it's essential to carefully review the company's profitability indicators. We believe this article will be helpful in evaluating the stocks you hold.
